Carbon Emission
Projects

HANDLE YOUR PROJECT WITH PROFESSIONALS
The Founders of The SKAFS Organic Consulting Group have a wealth of practical experience in the organic industry. They have worked in all fields of the industry from raising organic crops and livestock to managing organic processing plants.
Clean Development Mechanism
Transitioning From Conventional To Organic Agriculture

SKAFS International Mission Statement
To be the partner of choice for the world's leading service providers, governments and enterprises by helping them create, build and maintain the most innovative, reliable and cost-effective green technology. For this purpose, SKAFS maintains the highest levels of professionalism, integrity, honesty and fairness in our relationship with our suppliers, subcontractors, professional associates and customers.
To influence, encourage and assist societies throughout the world to conserve the integrity and diversity of nature and to ensure that any use of natural resources is equitable and ecologically sustainable.
Climate Change
Climate Change is a significant statistical variation of the average state or climate variabilities which occur during a long period (at least some decades or 30 years). In other words, climate change represents a trend in the behavior of a climate variable, for example, a trend towards an increase in average temperature.
Climate change revolves around the concept of "Greenhouse Effect". Some gases; such as Carbon- dioxide (C02), Methane (CH4), Nitrous oxide (N20), Per - fluorocarbons (PFCs), Hydro- fluorocarbons (HFCs), and Sulphur hexafluoride (SF6); naturally exist in the atmosphere that form a blanket surrounding the earth and keeps the earth warmer which is called Greenhouse Effect.
Global Warming
Human activities (fossil fuel burning, depletion of sinks like forests, etc.) has been increasing the concentration of GHGs in the atmosphere and is leading to rise in temperature. This is called Enhanced Greenhouse Effect.
Rise in temperatures of earth and other associated climatic changes as caused by the enhanced Greenhouse Effect is called "Global Warming" and in broader term it is called "Climate Change".
Global Warming Potential
GWP is an index, based upon radiative properties of well-mixed greenhouse gases, measuring the radiative forcing of a unit mass of a given well-mixed greenhouse gas in today's atmosphere integrated over a chosen time horizon, relative to that of C02. The GWP represents the combined effect of the differing lengths of time that these gases remain in the atmosphere and their relative effectiveness in absorbing outgoing infrared radiation. The Kyoto Protocol ranks greenhouse gases on the basis of GWPs from single pulse emissions over subsequent 100-year time frames. GWP is measured in C02- equivalent emission (IPCC, 2011, pp.959-960). While considering GWP value ofC02=1, GWP of methane (CH4) and nitrous oxide (N20) are 23 and 2 96, respectively, over a time horizon of 100 years.
Integrating Earth-Human Systems
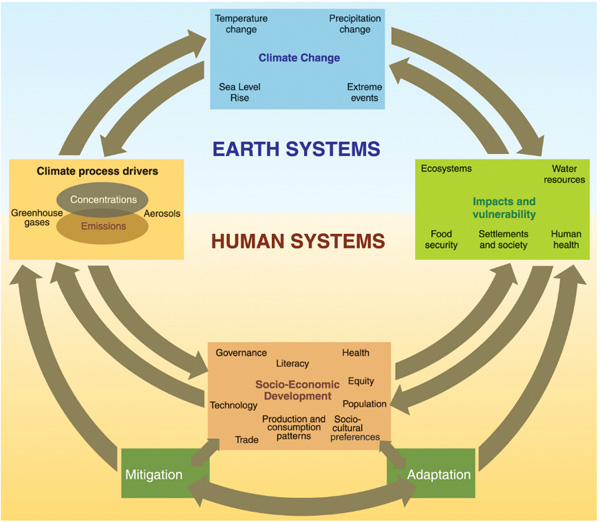
Title: Integration of Earth Systems - Human Systems
Source: IPCC Fourth Assessment Report, 2007, websource.
GHG Contribution in Global Warming
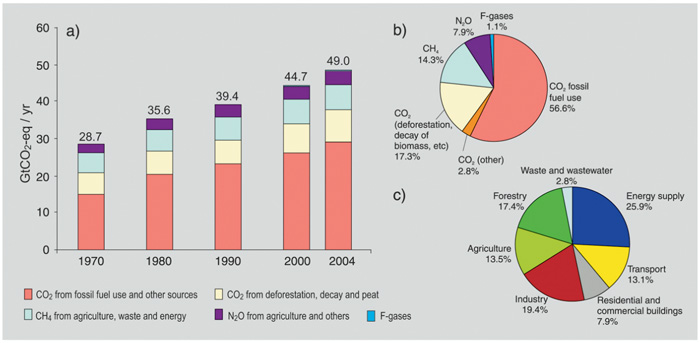
Title: Contribution of Different Sectors in GHGs Emissions
Source: IPCC Fourth Assessment Report, 2007, websource.
Impacts of GHG Contribution
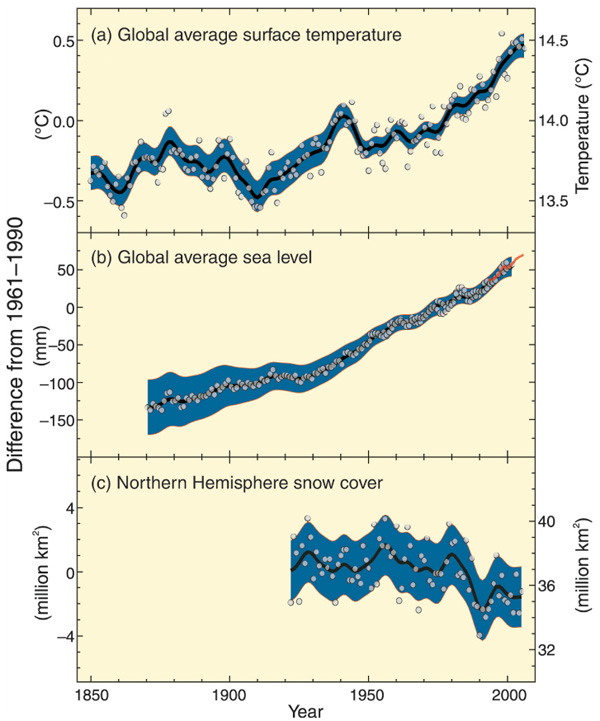
Title: Contribution of GHGs in Global Warming
Source: IPCC Fourth Assessment Report, 2007, websource.
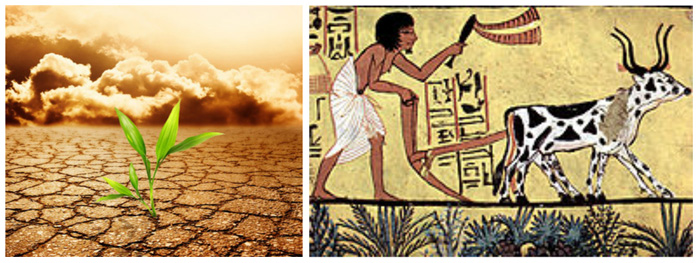
Issues of Conventional Agriculture
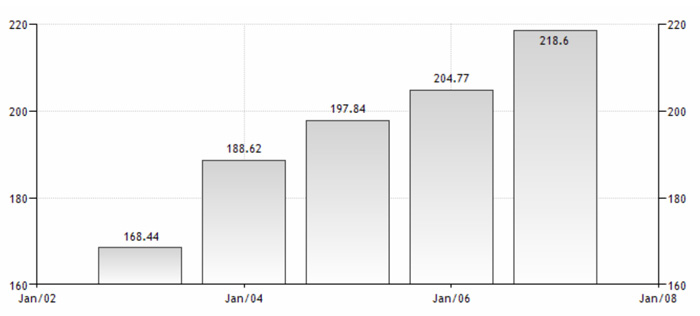
Title: General yield (kg per hectare) in Pakistan.
Source: Trading Economics website, 2012.
Title: Agricultural machinery;tractors per 100 sq. km of arable land in Pakistan.
Source: Trading Economics website, 2012.
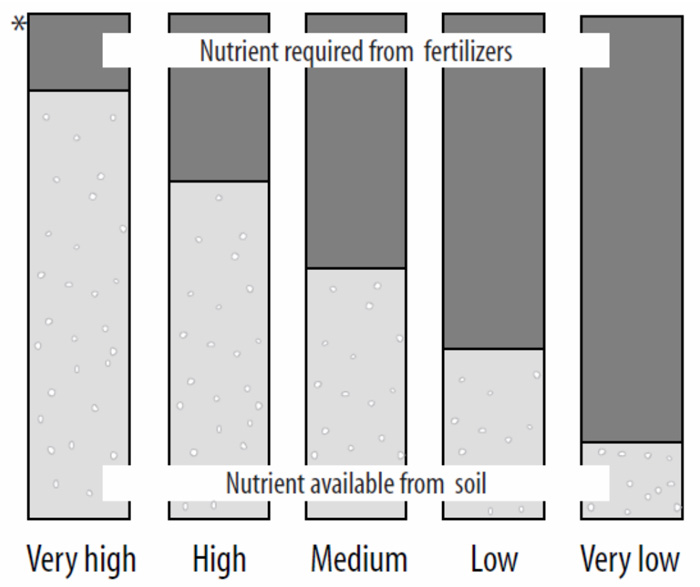
* Fertilizers used at 'very high' levels are for 'starter' or 'maintenance' purposes.
Title: Relative sources of nutrients at different soil test levels.
Source: FAO, 2000, p.51.
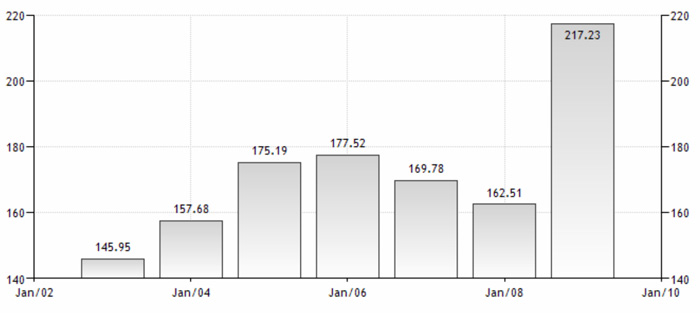
Title: Fertilizer consumption (kilograms per hectare of arable land) in Pakistan.
Source: Trading Economics website, 2012.
What is CDM?
The Clean Development Mechanism (CDM) was initiated under the Kyoto Protocol of the United Nations Framework Convention on Climate Change (UNFCCC) in order to explore cost-effective options to mitigate the impacts of climate change. It is one of the instruments that help the developing countries in achieving sustainable development, while at the same time contributes to the ultimate objective of the UNFCCC. CDM assists the developing countries to implement project activities that reduce Greenhouse Gas (GHG) emissions in return for generating Carbon Credits/ Certified Emission Reduction (CERs).
CDM Approval Cycle
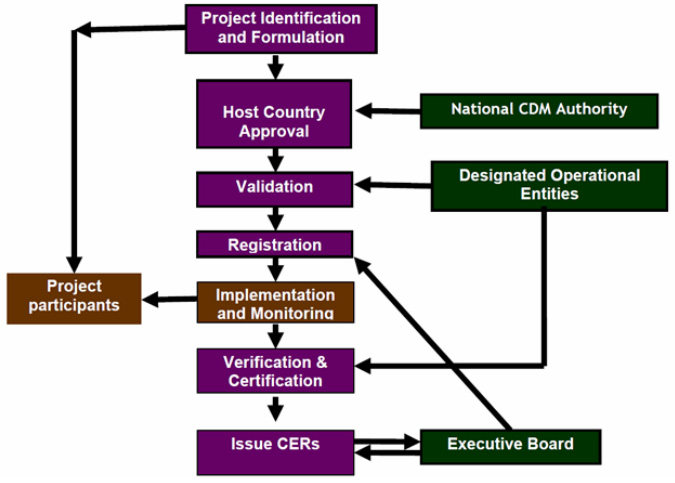
Title: CDM Project Cycle
Source: National Operational Strategy, 2006, p.10.
CDM Support Structure in Pakistan
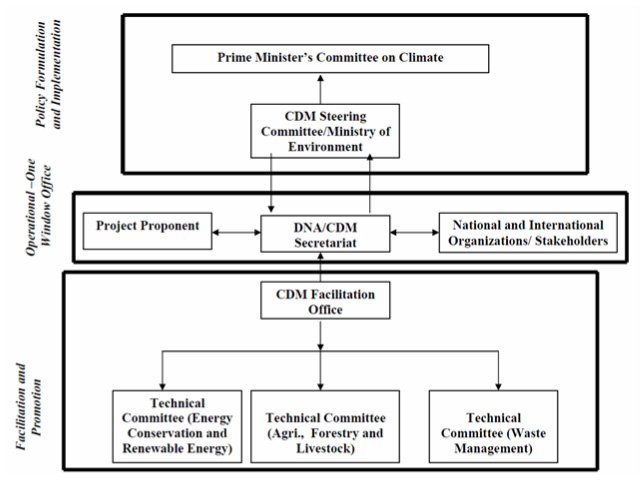
Title: Organogram of National CDM Authority
Source: National Operational Strategy, 2006, p.4.
Location of Project Site - Wan Miana
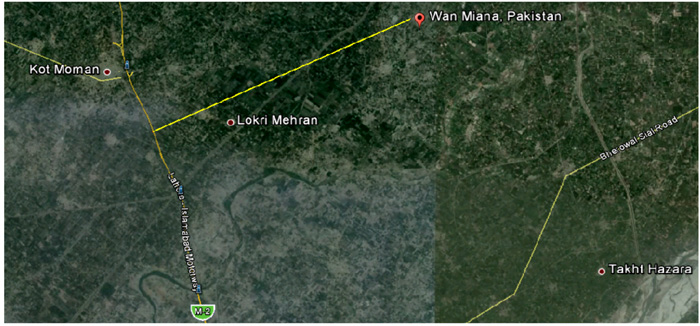
The project site is the agricultural land of Wan Miana in Punjab province of Pakistan. Total area of the site is roughly 130 acres and is roughly 12 kilometres from Lahore - Islamabad Motorway M2 Section.
Location of Project Site - Distance from District Sargodha
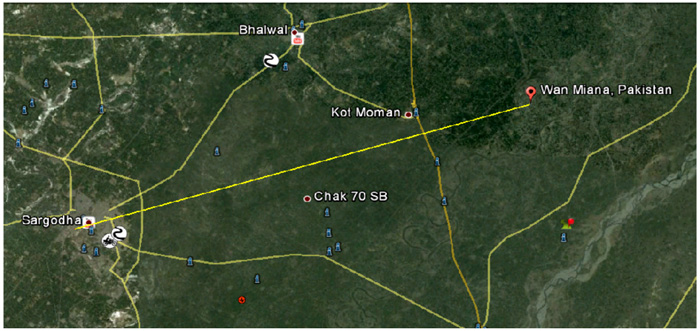
The project site is roughly 50 kilometres from District Sargodha. Wan Miana is located on River Chenab delta. The site is consisted of rich citrus producing gardens of Wan Miana. Livestock production is also a major component of food production.
Location of Project Site - In the Delta of River Chenab
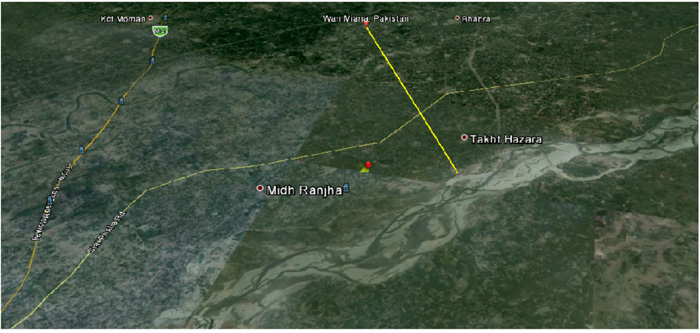
Wan Miana is located in the delta of River Chenab.
Location of Project Site , From Lahore - Islamabad Motorway(M2)
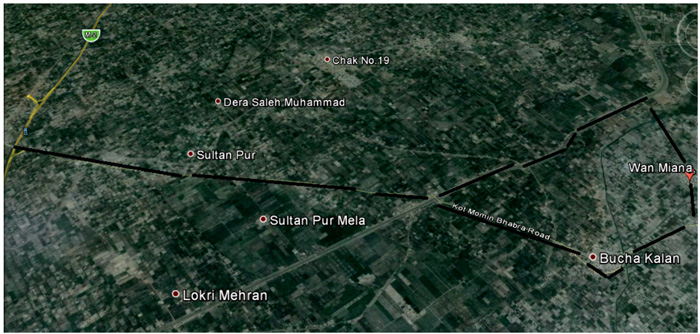
The site is easily accessible from Lahore-Islamabad Motorway (M2) through Kot Moman - Bhabra Road passing through Bucha Kalan. Alternate route to reach this site is through Kot Moman - Bhabra Road fallowing along Jhelum River Distributary canal road
Benefits of Biagas Technology
1. Least expensive energy solutions (heat, light and electricity).
2. Transformation of organic wastes into high quality fertilizer.
3. Improvement of hygienic conditions through reduction of pathogens, worm eggs and flies.
4. Reduction of workload, mainly for women, in firewoodcollection and cooking.
5. Environmental advantages through protection of forests, soil, air and water.
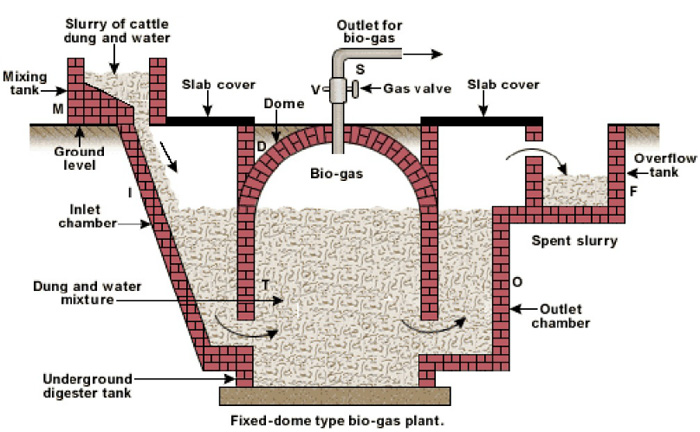
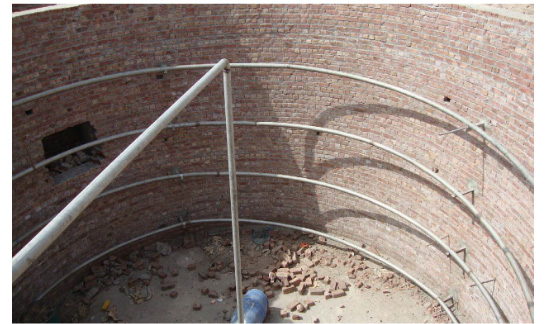
Fixed-dome Biogas Plant
Fixed-dome plant with separate gasholder.The gas pressure is kept constant.The use of an agitator is recommended.
Digester of this plant is a shallow well shaped masonry structure. No partition wall is provided.
Cost of maintenance is low and life span is comparatively long. Average cost of plant is about Rs. 52,000. Biogas digester with local materials such as bricks, sand, cement etc.
The instrumentation needed for the construction of the biogas plant are:
- An underground digester - may be made of bricks, stones, concrete etc
- An inlet pipe with a substrate receptacle
- An outlet pipe of exhauster slurry
- A gas outlet pipe.
- Raw material supplied to the biogas plant can be cow dung, human waste, wheat crops, sewage, paper waste, field grass.
Typical Design & Components of Biogas Plant
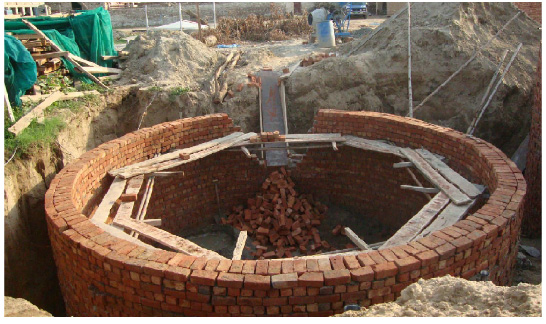
Masonry Work at Fermentation Unit
Layout of Heat Exchange System
Design of Biagas Plant
- Inner diameter of fermentation chamber = 4.88 m
- Depth of fermentation chamber = 4.27 m
- Volume of fermentation chamber = 80 cubic m
- Total weight of feeding material in fermentation chamber = 84 tons (Calculated on the basis of average dung production of 12kg/animal/day)
- Retention time = 42 days
- Diameter of feeding tank = 1.22 m
- Depth of feeding tank= 1.37 m
- Capacity of feeding tank = 1.6 cubic m
- Feeding material/day= 84/42 = 2 tons/day/plant
- Slurry (water: animal dung)= 1:1
- Animal dung required per day/plant = 1 ton
- Water required / day = 1 ton
- Number of plants = 2
- Animal required/plant based on collection ability = 70-80
- Gas production/day/plant = 50 cubic m
- Gas production based on 65 - 70% plant efficiency = 35 cubic m
- Diameter of gas holder = 5 m
- Height of gas holder = 1.22 m
- Type of mixer (feeding tank) = mechanical
- Stirring system (fermentation chamber) = mechanical
- Heat exchanger = hot water circulation (consume 10% of daily gas production in winter)
- Average gas consumption/person/day = 0.5 cubic m (for cooking and lighting)
- Average family size = 8 members
- Total gas consumption/family/day = 4.0 cubic m
- Gas consumed by a family in 3 days = 12 cubic m
- Total gas production by plant in 3 days = 105 cubic m
- Gas available for factory and tube well operation = 93 cubic m
- Tube well engine power (assumptions) = 25 hp
- Gas consumption/hr = 9 cubic m
- Tube well operation duration = 10 hrs
- A tube well (25 hp Engine) of 1 cusec discharge will be operated 10 hrs in a week and a family of 8 family members will also be accommodated for cooking and lighting purpose.
- An addition of 1 ton poultry waste for same retention period can generate same amount of biogas that will be enough for running a small factory unit.
- By installation of 2 biogas plants we can run 4 tube wells of 1 cusec discharge running for 10 hr/day, running one factory unit and accommodating 2 families of 8 members to fulfill their cooking and lighting requirements.
Cost-Benefit Analysis of Biogas Plant
- Diesel consumption for running a tube well for 10 hr/day @4L/hr = 40 (L/day)
- Diesel consumption for 3 days/week = 120 (L/week)
- Diesel consumption for 1 month = 120 x 4 = 480 (L/month)
- Cost of operating 1-tube well for 1 month = 480 x 100 = Rs.48,000
- Cost of operating 1-tube well for 1 year for 7 months/year = Rs. 48,000 x 7=Rs. 336,000
- Cost of operating 4-tube wells for 1 year for 7 months/year = Rs.1,344 ,000
- Cost of application of fertilizers (Super Sulfur, Ammonium Nitrate, Potassium Nitrate & Urea)@ Rs.10000 per acre= Rs.10000 x 130 = Rs.1,300,000
- Cost of application of fertilizers for two time in a year = Rs. 1,300,000 x 2 = Rs. 2,600,000
- By operating one small factory unit and 4-tube wells with biogas and application of bio-slurry all operational costs can be avoided.
- Emission reductions are calculated as follows:
ERy = BEy - PEy
Where:
ERy = Emission reductions in year y (tC02e/yr)
BEy = Baseline emissions in year y (tC02e/yr)
PEy = Project emissions in year y ( tC02e/yr)
- Online tool to calculate CERs:
http://www.carbonfootprint.com
- Credit issued for Certified Emission Reduction (CERs) to offset the carbon footprint of 3763 tons C02e per year = $56,440.00 = Rs.5,644,000.00/year
References
- IPCC(Intergovernmental Panel on Climate Change), (2007), "Fourth Assessment Report", downloaded from the website:
http://www.ipcc.ch/publications_and_data/publications_and_data_figures_and_tables.shtml#.UWu0vFf_n61 on April 15.2013.
- IPCC (Intergovernmental Panel on Climate Change), (2011), "Special Report on Renewable Energy Sources and Climate Change Mitigation (SRREN)", Annex-I Glossary of Terms, pp.959-960, downloaded from the website:
http://www.ipcc.ch/publications_and_data/publications_and_data_glossary.shtml#.UWvNOFf_n6k on April 15, 2013.
- Trading Economics (2012), "Fertilizer consumption (kilograms per hectare of arable land) in Pakistan", downloaded from the website:
http://www.tradingeconomics.com/pakistan/fertilizer-consumption-kilograms-per-hectare-of-arable-land-wb-data.html, on April 6, 2013.
- Trading Economics (2012), "Agricultural machinery; tractors per 100 sq. km of arable land in Pakistan", downloaded from the website:
http://www.tradingeconomics.com/pakistan/agricultural-machinery-tractors-per-100-sq-km-of-arable-land-wb-data.html, on April 6, 2013.
- Trading Economics (2012), "Cereal yield (kg per hectare) in Pakistan", downloaded from the website:
http://www.tradingeconomics.com/pakistan/cereal-yield-kg-per-hectare-wb-data.html, on April 6, 2013.
- FAO (Food and Agriculture Organization), (2000), "Fertilizers and their use", A pocket guide for extension officers, International Fertilizer Industry Association, fourth edition, p.51. UNFCCC (United Nations Framework Convention on Climate Change), (2013), "Global Warming Potentials", retrieved from the website:
http://unfccc.int/ghg=data/items/3825.php on April 15, 2013.
CDM Projects of SKAFS & Associates
A brief story about how this process works, keep an eye till the end.
• Fatima N2O Abatement Project, Multan, Pakistan.
• Catalytic N2O Abatement project in the Tail Gas of Nitric acid plant of Pak Arab Fertilizer, Multan, Pakistan.
• Nitric Acid plant at Dongbu Hannong Chemicals Ltd., Ulsan, South Korea.
• Deepak WNA 5 N2O Abatement Project India.
• Project for catalytic reduction of N2O emissions with a secondary catalyst inside the ammonia reactor of Nitric Acid Plant at African Explosives Ltd.,South Africa.
• Junma N2O abatement project from Nitric Acid Plant at Haifa Chemicals Ltd., China.
• YARA Montoir N2O Abatement project, France.
Renewable Energy Projects
A brief story about how this process works, keep an eye till the end.
• Design of Contrada Dumi San Nicola, Wind farm 10 wind turbines total power of 20 MW.
• Design of MV/HV substation transformer of the Serra di Spezi Wind farm 12 Wind turbines total 24 MW.
• Design of MV/HV substation transformer of the Gargalupo Wind farm 14 Wind turbines with total nominal of 28 MW.
• Design of a Wind farm 9 generators 8 MW plant in Aragona (2003)
• Design of Wind farm project at Pecoraro Mount, Cinisi Municipality (2001)
• Design of a Photovoltaic Solar Plant 0.95 MW (2002)
Biogas Projects
A brief story about how this process works, keep an eye till the end.
• Biogasification & Cattle Waste Management
a) Wan Miana, Sargodha (2013-Ongoing)
b) Noon Farms, Khushab(2012-Ongoing)
c) Syed Abid Hussain Farms, Jhang(2013-Ongoing)